Browsing a Heap Dump
You can use VisualVM to browse the contents of a heap dump file and quickly see the allocated objects in the heap. Heap dumps are displayed in the heap dump sub-tab in the main window. You can open binary format heap dump files (.hprof) saved on your local system or use VisualVM to take heap dumps of running applications.
A heap dump is a snapshot of all the objects in the Java Virtual Machine (JVM) heap at a certain point in time. The JVM software allocates memory for objects from the heap for all class instances and arrays. The garbage collector reclaims the heap memory when an object is no longer needed and there are no references to the object. By examining the heap you can locate where objects are created and find the references to those objects in the source. If the JVM software is failing to remove unneeded objects from the heap, VisualVM can help you locate the nearest garbage collecting root for the object.
Opening a Heap Dump File
If you have a heap dump file saved on your local system, you can open the file in VisualVM by choosing File > Load from the main menu. VisualVM can open heap dumps saved in the .hprof file format. When you open a saved heap dump, the heap dump opens as a tab in the main window.
Taking a Heap Dump
You can use VisualVM to take a heap dump of a local running application. When you use VisualVM to take a heap dump, the file is only temporary until you explicitly save it. If you do not save the file, the file will be deleted when the application terminates.
You can take a heap dump by doing either of the following:
- Right-click the application in the Applications window and choose Heap Dump.
- Click Heap Dump in the Monitor tab of the application.
Heap dumps for a local application open as sub-tabs in the application's tab. The heap dump also appears as a time-stamped heap dump node under the application node in the Applications window. To save a heap dump to your local system, right-click the heap dump in the Applications window and choose Save As.
Browsing a Heap Dump
VisualVM enables you to visually browse heap dumps in the following views:
Summary View
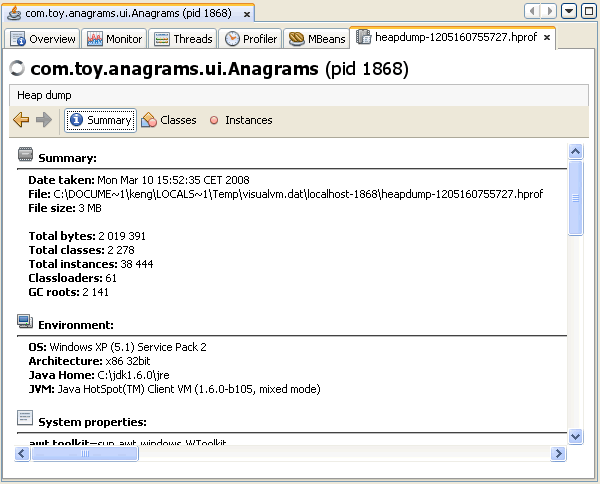
When you open a heap dump, VisualVM displays the Summary view by default. The Summary view displays the running environment where the heap dump was taken and other system properties.

Classes View
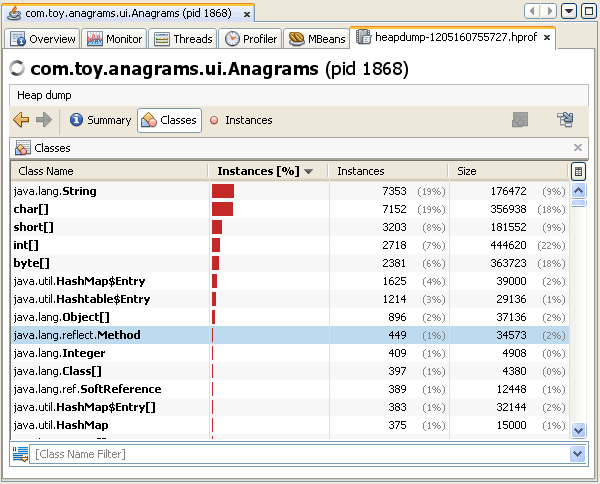
The Classes view displays a list of classes and the number and percentage of instances referenced by that class. You can view a list of the instances of a specific class by right-clicking the name and choosing Show in Instances View.
You can sort how results are displayed by clicking a column heading. You can use the filter below the list to filter the classes by name or limit the displayed results to sub-classes of a class by right-clicking a class name and choosing Show Only Subclasses.

Instances View
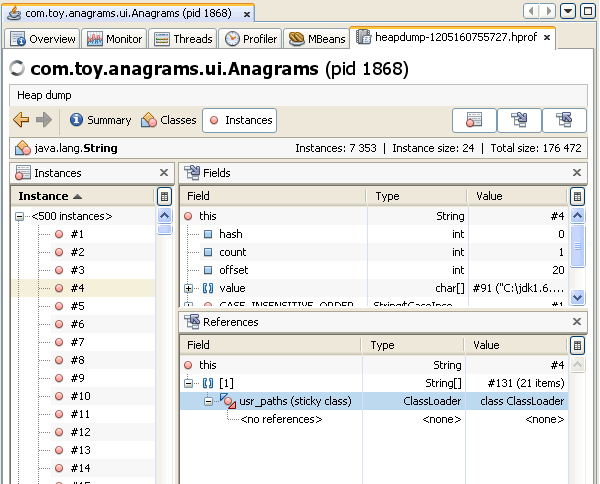
The Instance view displays object instances for a selected class. When you select an instance from the Instance pane, VisualVM displays the fields of that class and references to that class in the respective panes. In the References pane, you can right-click an item and choose Show Nearest GC Root to display the nearest garbage collection root object.


