Profiling Applications
VisualVM presents data for local and remote applications in a tab specific for that application. You can have multiple application tabs open. Each application tab contains sub-tabs that display different types of information about the application.
Profiling applications
The Profiler tab of an application enables you to start and stop the profiling session of a local application. Profiling results are displayed in the Profiler tab. You can use the toolbar to refresh the profiling results, invoke garbage collection and save the profiling data.
By default the profiling tool is not running until you are ready to profile the application. You can choose from the following profiling options:
- CPU Profiling. Choose this to profile the performance of the application.
- Memory Profiling. Choose this to analyze the memory usage of the application. The results display the objects allocated by the application and the class allocating those objects.
When you start a profiling session, VisualVM attaches to the local application and starts collecting profiling data. When profiling results are available they are automatically displayed in the Profiler tab.
Using the toolbar
You can use the following buttons in the Profiling Results toolbar to work with profiling results:
- Update Result Automatically. When active, the displayed profiling results are automatically updated at short intervals (about 2 seconds).
- Update Result Now. Click to update results immediately.
- Run Garbage Collection. Click to run garbage collection.
- Reset Collected Results. Click to discard the already accumulated profiling results.
- Take Snapshot. Click to take a snapshot of the current profile data. When you take a snapshot, the snapshot is opened in a new sub-tab.
- Save Current View. Click to save the current view of the profiling results as a .png image file. When you click the button you are prompted to choose the location where you want to save the image.
Filtering profiling results
The filter box below the profiling results enables you to filter the displayed results according to the name of the method. To filter the results, enter a term in the method name filter box, select which filtering method to use and press Return. You can see and select previous filter terms by clicking the arrow to the right of the method name filter box.
Modifying profiling settings
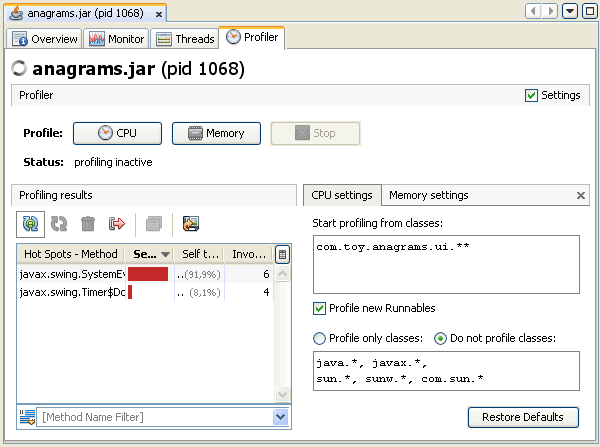
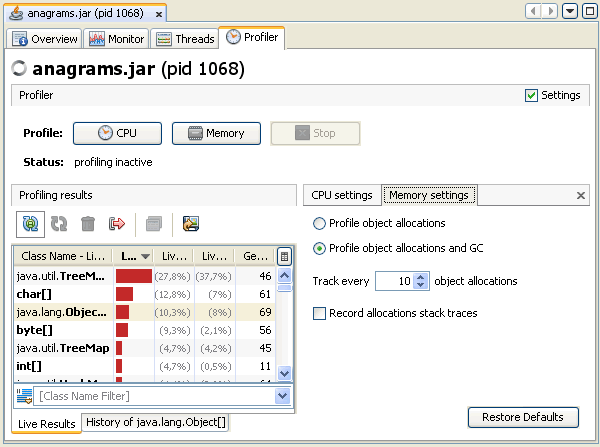
The VisualVM profiling tool supplies default settings for profiling applications. You can view the default settings by selecting the Settings checkbox in the Profiler tab. You can modify the profiling settings when no profiling session is in progress.
CPU Profiling
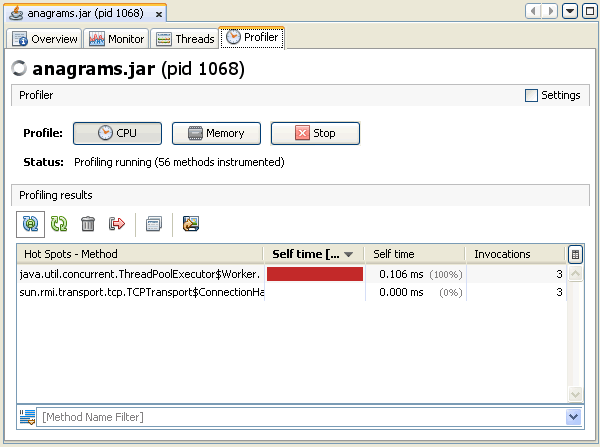
This profile command returns detailed data on method-level CPU performance (execution time), showing the total execution time and number of invocations for each method. When analyzing application performance, VisualVM instruments all of the methods of the profiled application. Threads emit the "method entry" event when entering a method and generate the corresponding "method exit" event when exiting the method. Both of these events contain timestamps. This data is processed in real time.
Screenshot of Profiler tab showing CPU profiling results
Screenshot of Profiler tab showing CPU profiling settings
Memory Profiling
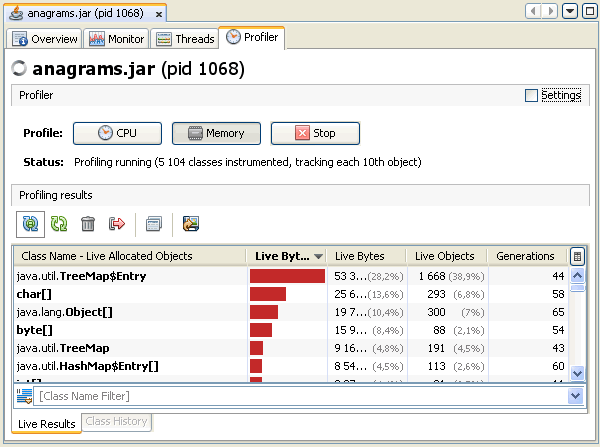
When you analyse memory usage, VisualVM starts instrumenting the loaded classes and displays the total number of objects allocated by each class (including array classes) in a table. For each class currently loaded class in the Java Virtual Machine (JVM), the profiling results display the size and number of objects allocated since the profiling session started. The results are automatically updated as new objects are allocated and as new classes are loaded.
VisualVM displays the number of objects as an absolute number and as a percentage. The bytes allocated are also displayed as a graph representing the percentage of bytes as well as the total number of bytes allocated by each class.
Screenshot of Profiler tab showing memory profiling results
Screenshot of Profiler tab showing memory profiling settings
Taking Profiler Snapshots
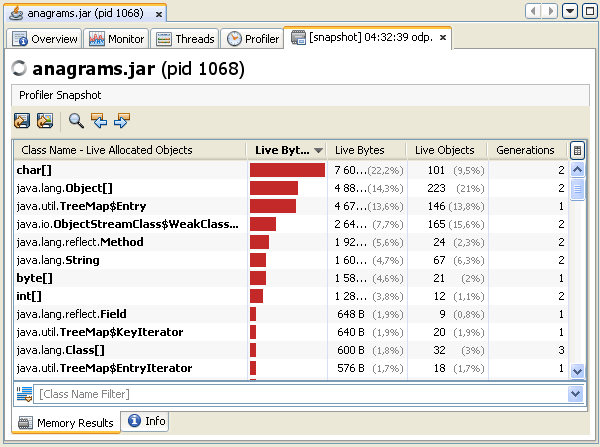
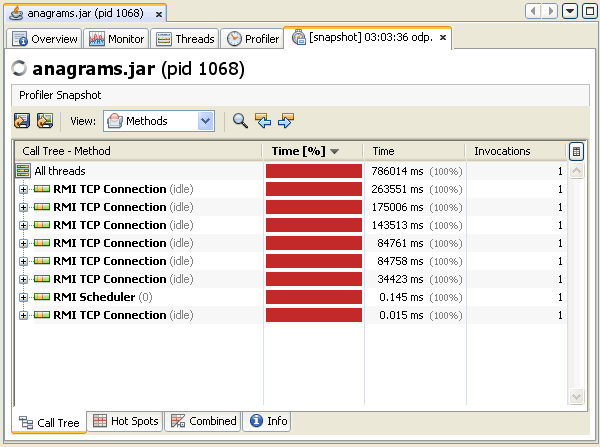
VisualVM enables you to take profiler snapshots to capture the results of a profiling session. A profiler snapshot captures the results at the moment the snapshot is taken. To take a snapshot, click the Take Snapshot of Collected Results button in the toolbar while a profiling session is in progress. When you take the snapshot, the snapshot opens as a tab in the application tab. A node for the snapshot also appears under the application node in the Applications window.
Screenshot of memory profiling snapshot
Screenshot of CPU profiling snapshot
For more about profiler snapshots, see the following document:

